Accessibility

Using AI to suggest accurate benchmarks.

League of American Bicyclists

The League of American Bicyclists: The Bicycling and Walking in the U.S. 2016 Benchmarking Report Home Page on an iPad

Dynamic data tools to empower civic activists.

We knew that this multi-stakeholder, comprehensive Benchmark Report could start a transportation revolution – if it were digitized and simplified.

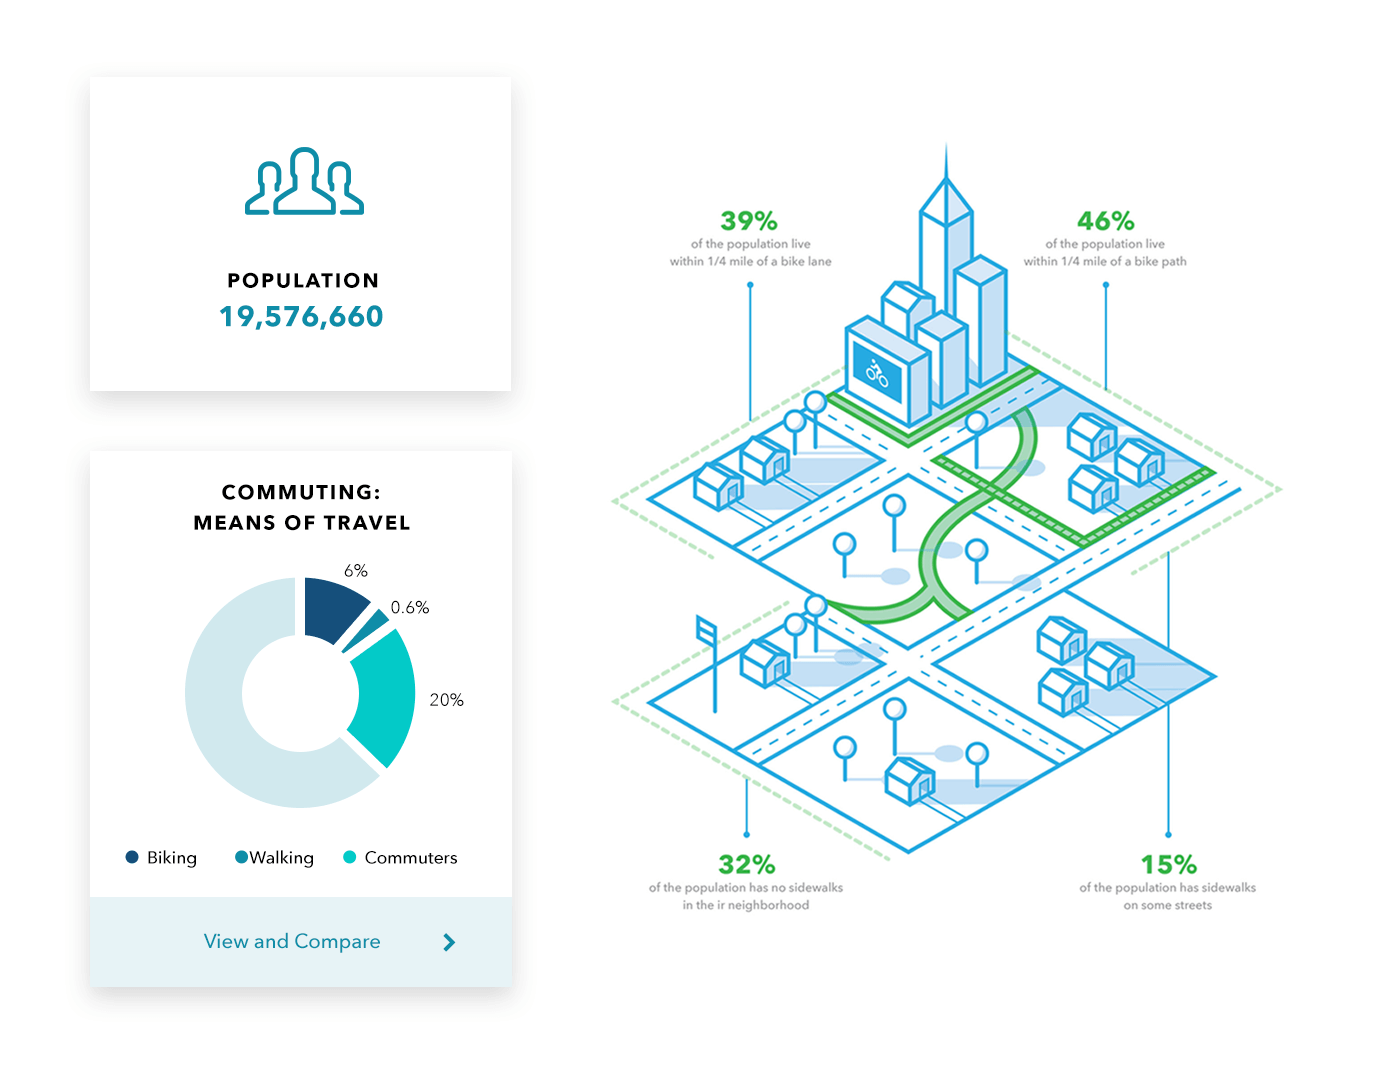
So, we took a book with 175+ pages of statistics and made it a simple, elegant, easy-to-navigate website that people could actually use and share.

An image of the League of American Bicyclists: The Bicycling and Walking in the U.S. 2016 Benchmarking Report Selection Page on a MacBook

Reimagining the story with custom reports.

We worked to simplify the story though compelling, engaging interfaces, paired with a range of back-end and front-end tools to help point people to the most relevant datasets.

And we enabled audiences with a specific topic interest (environment, health, a specific location, etc.) to quickly find and share content of interest to them, as well as providing pathways to make all data available for super-users.

League of American Bicyclists: The Bicycling and Walking in the U.S. 2016 Benchmarking Report Infographics