By the numbers
Reddit is the 6th most visited website in the United States. Their monthly user base is roughly the same size as the population of the contiguous United States, plus another 100 million. Numbers aside, marketers and businesses know Reddit is important.
It’s a platform ripe for reaching customers. But it’s challenging to blend in. After all, the Reddit-sphere is a notorious walled garden, where anonymous Redditors can roam free to say and do as they please – a stark contrast to platforms like Facebook, where your identity is watermarked to everything you do.
Brands could benefit from understanding the nuances of Reddit – the sentiment score of the latest posts, the keywords and colloquialisms, the similarities of multiple subreddits – but there are limited tools that enable social analysis of the platform.
So we built a prototype.
How it can work for digital marketing
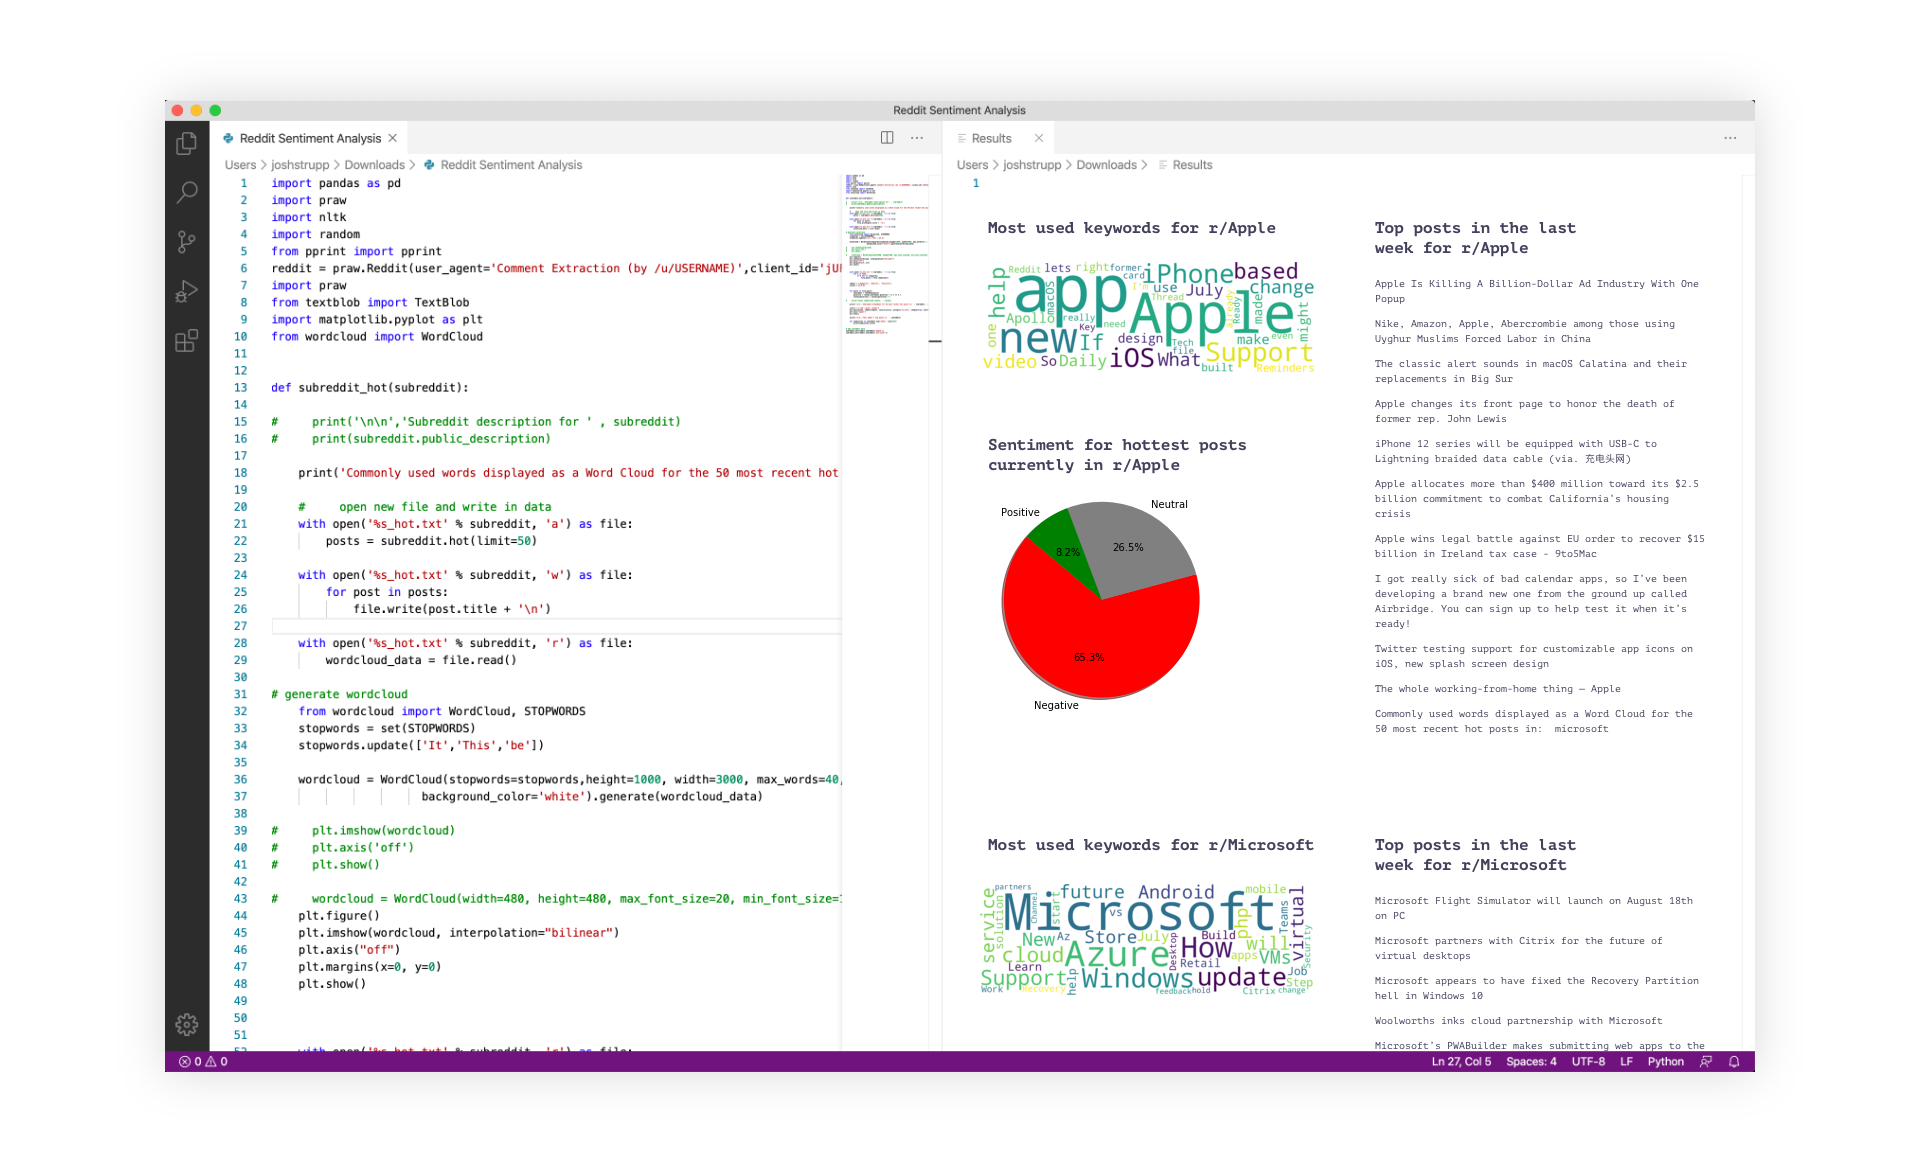
Simply input a Subreddit or group of Subreddits – r/science, r/LifeProTips, r/PersonalFinance, etc. – and a visualization appear, displaying keywords and their density, as well as a breakdown of sentiment extracted from the 50 hottest posts from the last 24 hours. The result will also include a list of the most popular posts from the previous week (this can be easily changed to a day, month, or year). If you are comparing two Subreddits, the result will include a correlation score to inform users of Subreddit similarity.
Below are sample outputs generated from our initial proof of concept:

Through the lens of digital marketing strategy, this tool can be applied to just about any industry. Take a tech startup creating naming conventions for the IA of new a software, or a D2C product looking for brand identity – understanding natural language trends in communities (subreddits) can be useful. Maybe it’s a nonprofit looking to raise funds for a seasonal initiative. Leveraging sentiment analysis can help identify which communities are more likely to engage, interact positively, and share the cause. Let’s say a marketing team is assessing where to allocate budget between different affinity groups or, more specifically, individual subreddits – you can run a quick comparative analysis to see which might be more receptive to your message, and find similar subreddits where you can expand your reach.
This data can be leveraged beyond Reddit and across the social sphere. If you understand your audience’s habits on Reddit, it pulls back the curtain on their expectations and colloquialisms to leverage these in messaging, branding, UX design, and building out creative campaigns across digital channels.
The product roadmap
This is test number one. The goal was to bolster the toolset available to our clients and provide them with proprietary data that will inform marketing and product efforts. But our sites are set on the moon! Our goal is to create a feature-rich, user-friendly data visualization tool for our clients (and beyond!).

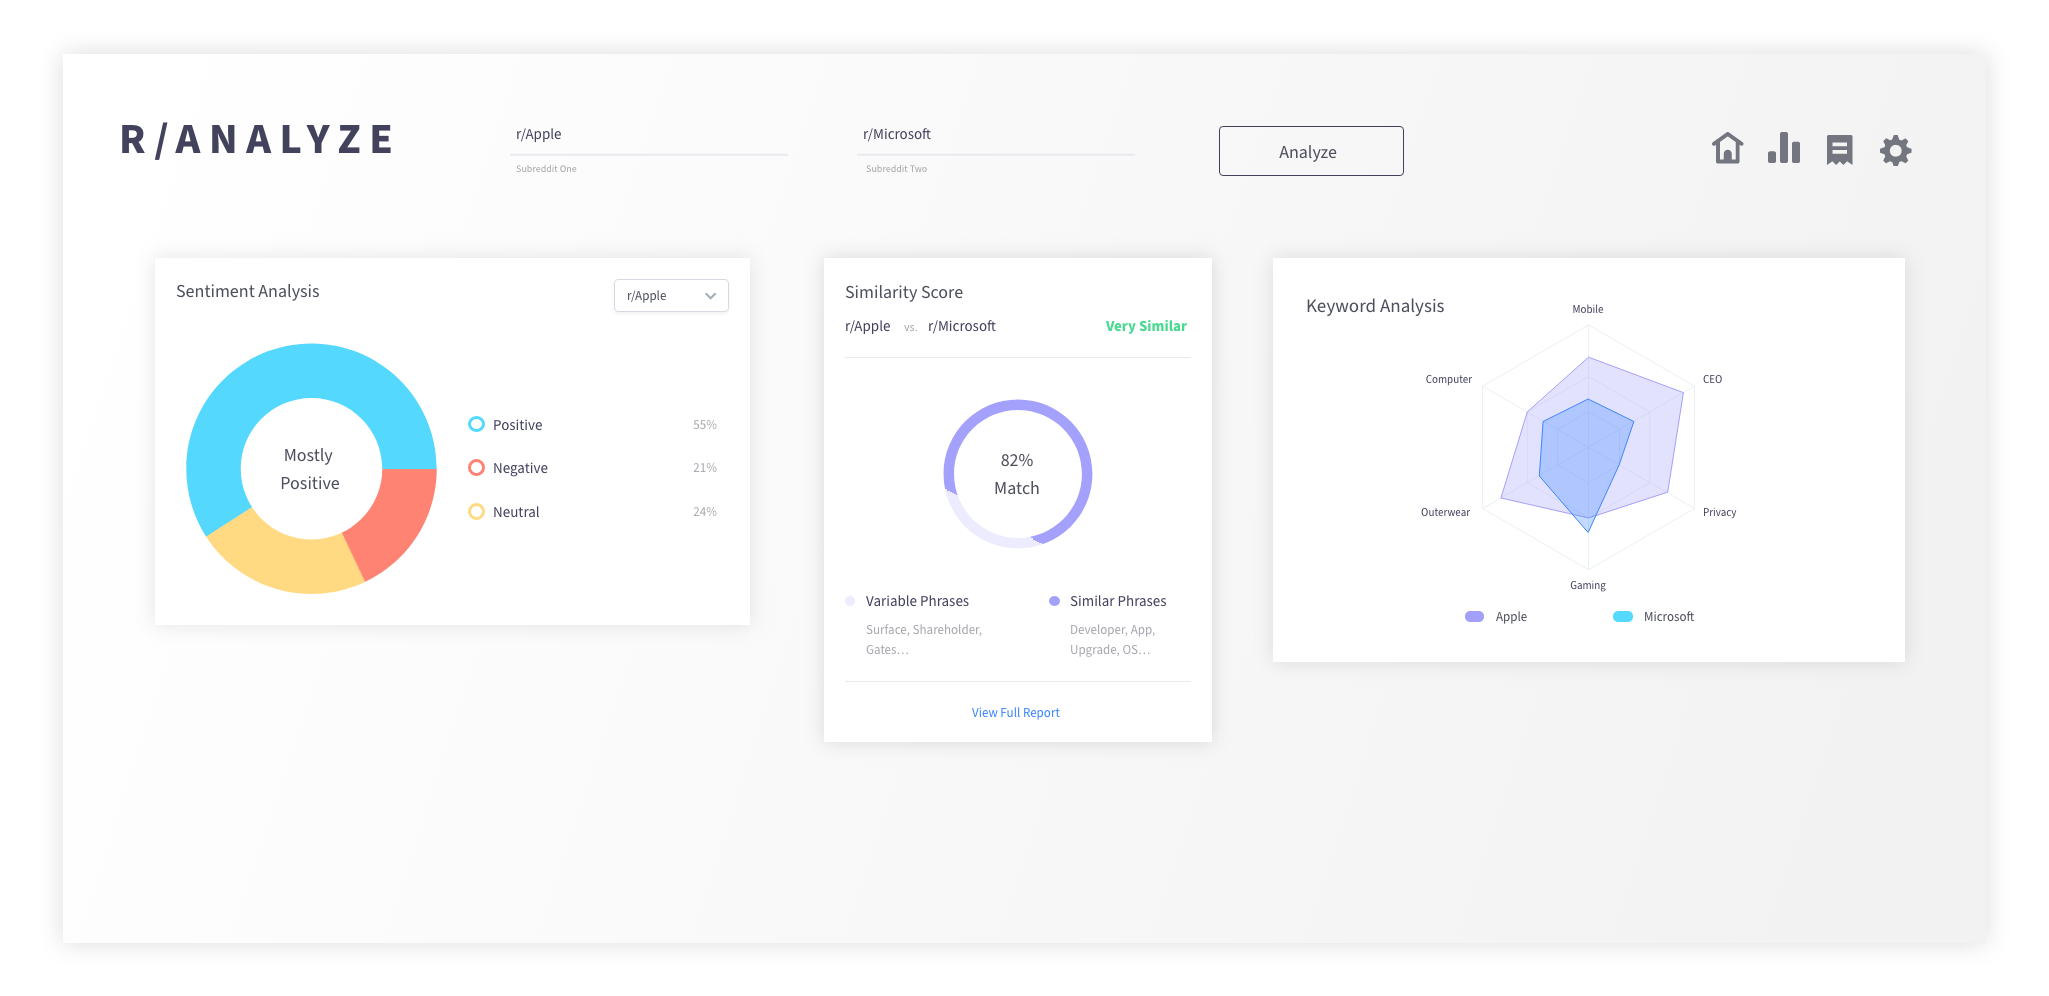
Above is an early design for r/Analyze (very much a working title :D). There are hundreds of more use cases and thousands of ways to build out this prototype to include additional querying tools. Our feature roadmap includes:
- Analyze messaging and sentiment in real-time.
- Bolster querying tools with a GUI that mimics Google Analytics or Tableau, enabling advanced filtering, custom parameters, and more.
- Leverage PushShift data to look historically at larger volumes of data to answer fundamental questions about your audience and their behavior.
Bolster querying tools with a GUI that mimics Google Analytics or Tableau, enabling advanced filtering, custom parameters, and more.
Leverage PushShift data to look historically at larger volumes of data to answer fundamental questions about your audience and their behavior.
Into the weeds
Using Python 3 as our analytics engine, and a package known as PRAW to scrape data from Reddit, we generated a function that pulls information from a chosen Subreddit or group of Subreddits and funnels it through three scripts. The first produces a result that is the butt of many jokes but nevertheless continues to be a very useful tool – the word cloud. Using Python’s WordCloud module, we simply remove “stop words,” or extraneous words like “it” or “this,” then create a word cloud from the previously pulled data.

The second uses the same data and passes it through a module called TextBlob, which performs some simple natural language processing to label all words in a data set. It can identify part of speech, extract specific phrases, and – perfect for our purposes – analyze words for their sentiment. We repeat the process of removing stop words, do a little math to convert sentiment score into percentages, and generate a pie chart.
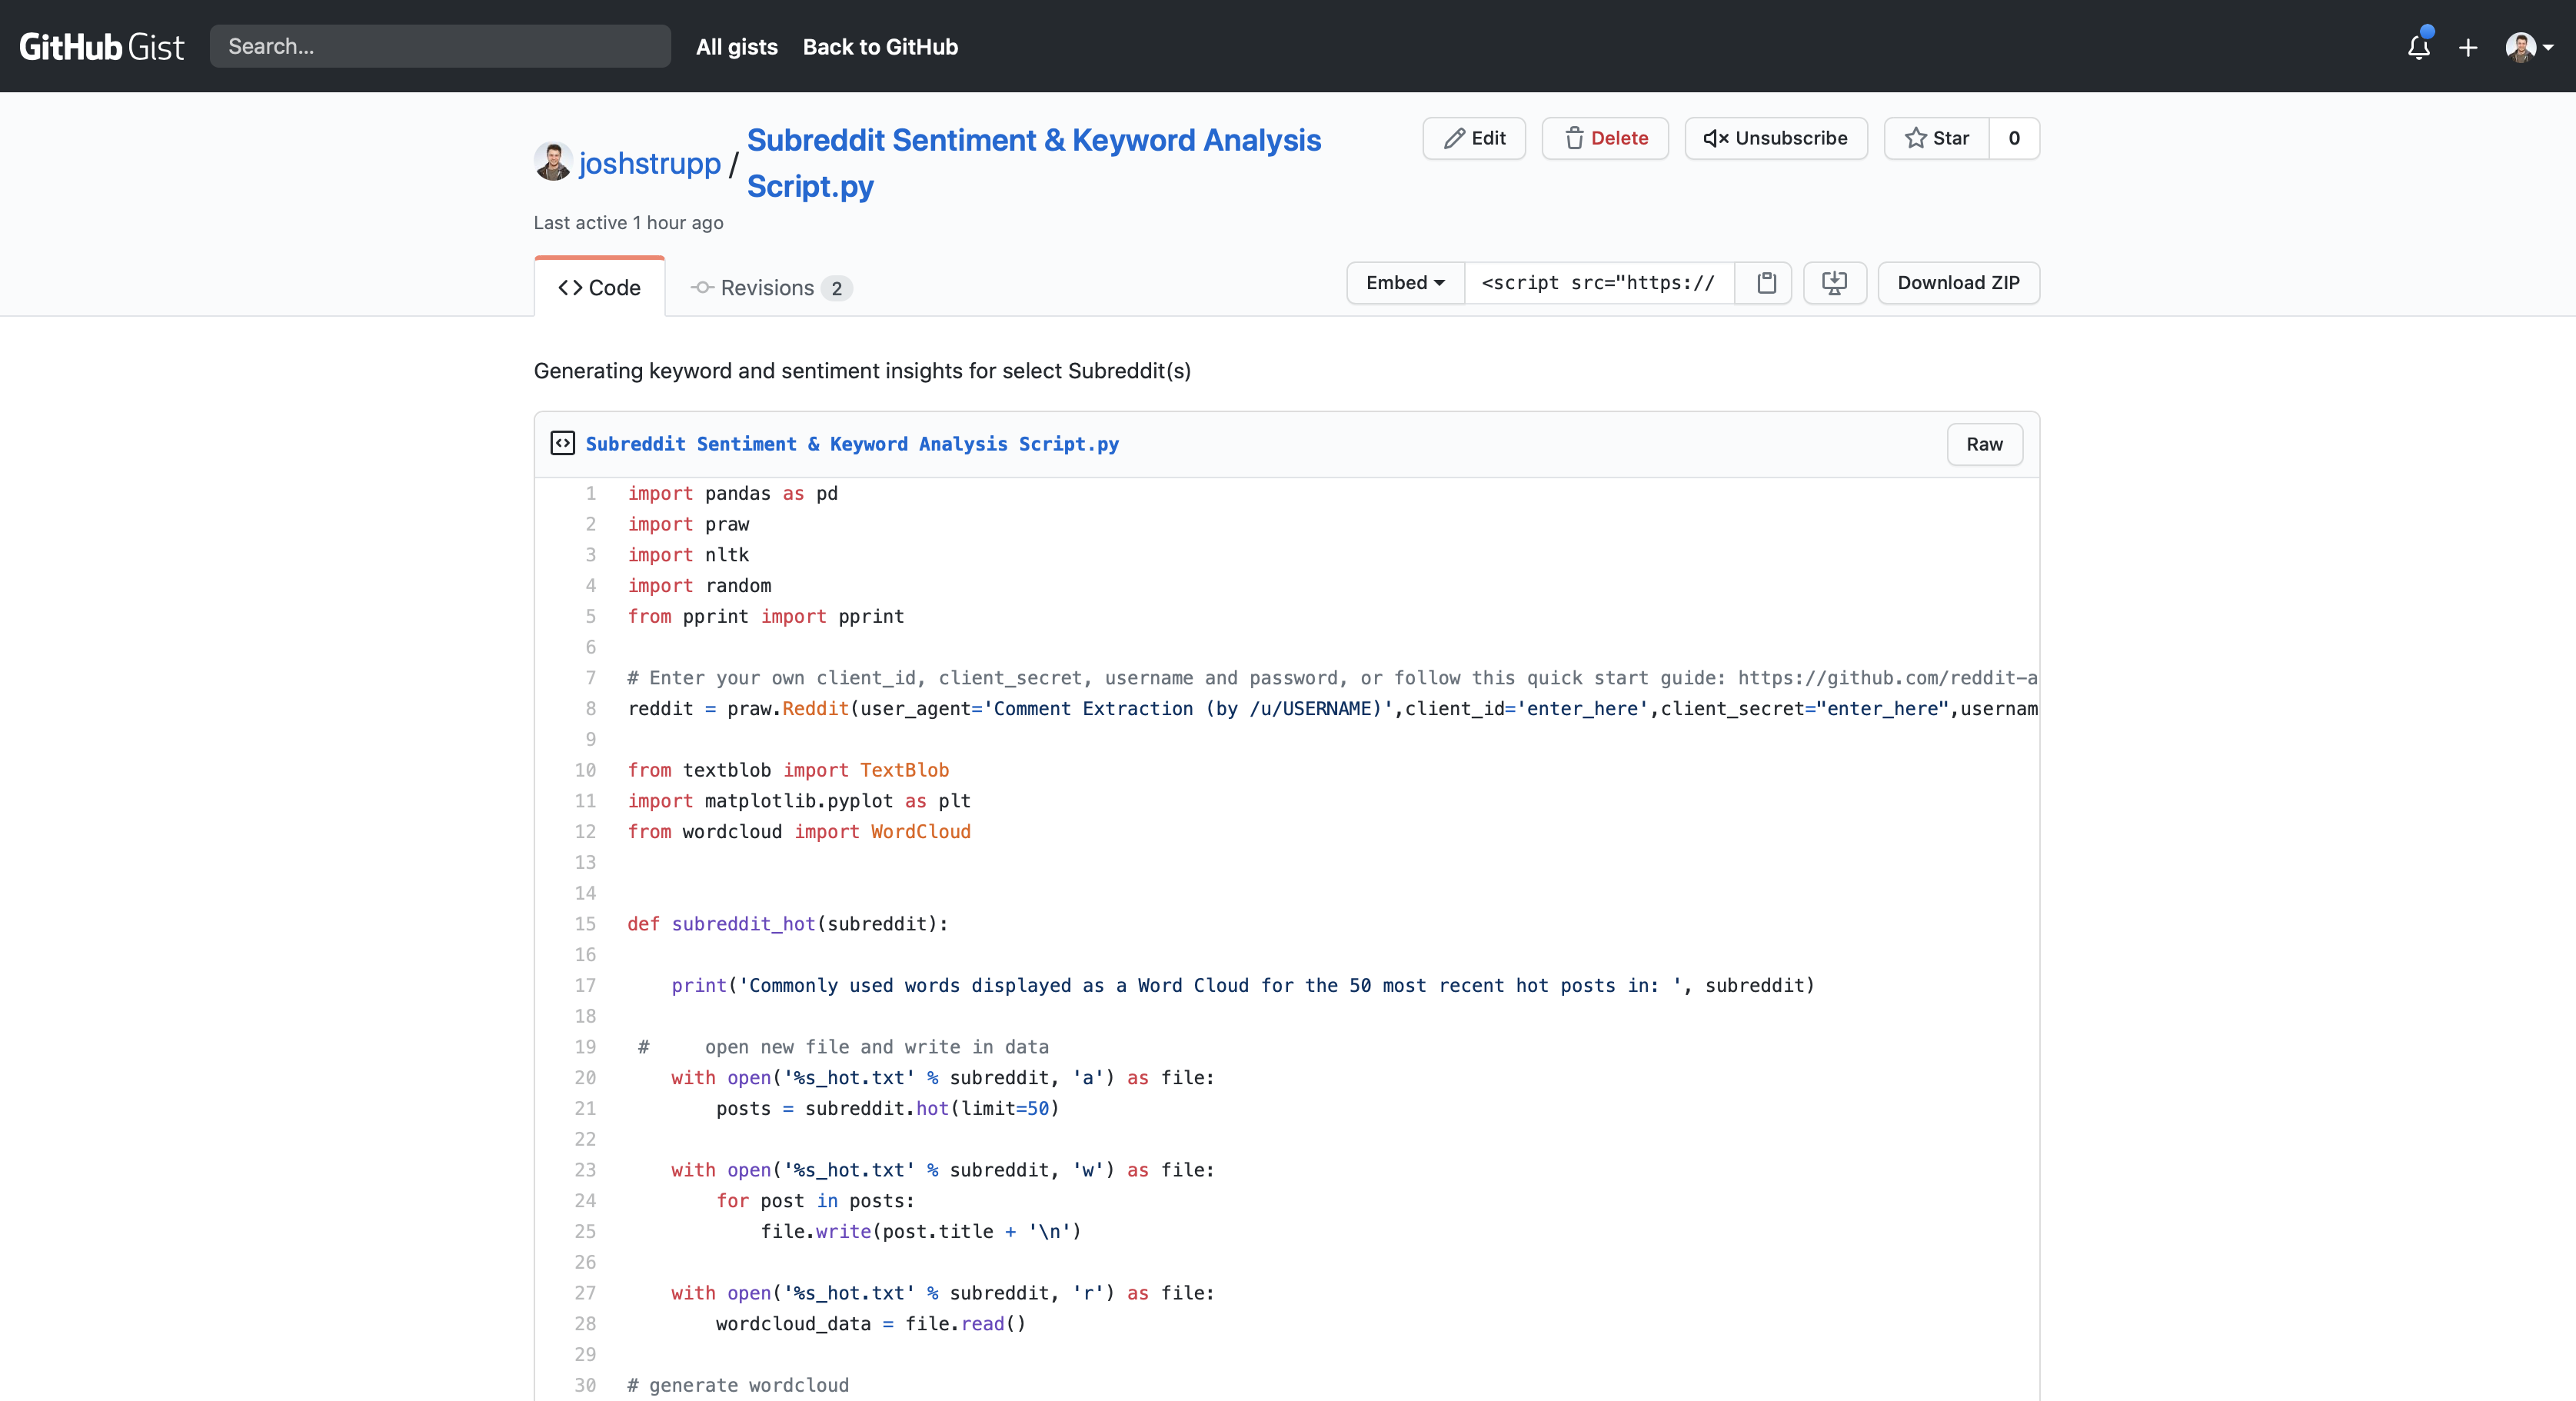
We merged both the word cloud and sentiment analysis into one function that also displays the top posts of the past week. Check it out and try it yourself.
Lastly, using a series of text analysis frameworks – namely Gensim and LDA modeling – we can train a model to recognize similarities in different groups of words. When comparing a list of subreddit descriptions, for example, we can algorithmically generate a score that measures similarities in phrasing, tone, and subject matter. Check out the code here.
Get in touch
Of course, no blog post is complete without the obligatory call to action if your organization is looking for marketing services, creative development, or a team that can solve just about any problem with code and a touch of ingenuity, holler at us!
For comments or questions about our Reddit insight generator, holler at me – [email protected]. You can also check out more of my work at joshstrupp.com.
If you’re interested in working together, shoot an email to [email protected]. We promise there are zero robots on the other end.